 |
|
|
|
|
|
|
|
|
|
|
|
updated 3/4/08
| For Sale | ||||
| Yearlings | ||||
| Bucks | New Arrivals | Kidding Schedule | Links | Herdbook |
Milk test has been an interesting experience, and I have played with various ways to compare my test results with those of other herds. Each month when I get my results, I plot the milk in pounds as a function of time, and the resulting graphs are enlightening. But the data presented this way are still hard to compare to published results, because each listing is a snapshot of the total milk produced by that particular doe after a certain number of days. Unless one of my does happens to have a value for that same number of days, it can't be compared easily. Just averaging the total pounds of milk by the number of days in milk doesn't give a very satisfactory answer either, as that value can vary greatly over the course of a lactation--a doe that was dried off early, for example, can have an inflated value of pounds per day produced, because the later part of the lactation when milk production is dropping is not icluded. So I decided to plot cumulative milk production as a function of time for all my does in milk, and found that it was a beautifully smooth plot, and further, that it very clearly revealed to me which of my does are the best milkers. I can look at a milk record and trace the point on my plot to see which of my milkers compares with that result. So here is the plot, with data current for February, 2008:
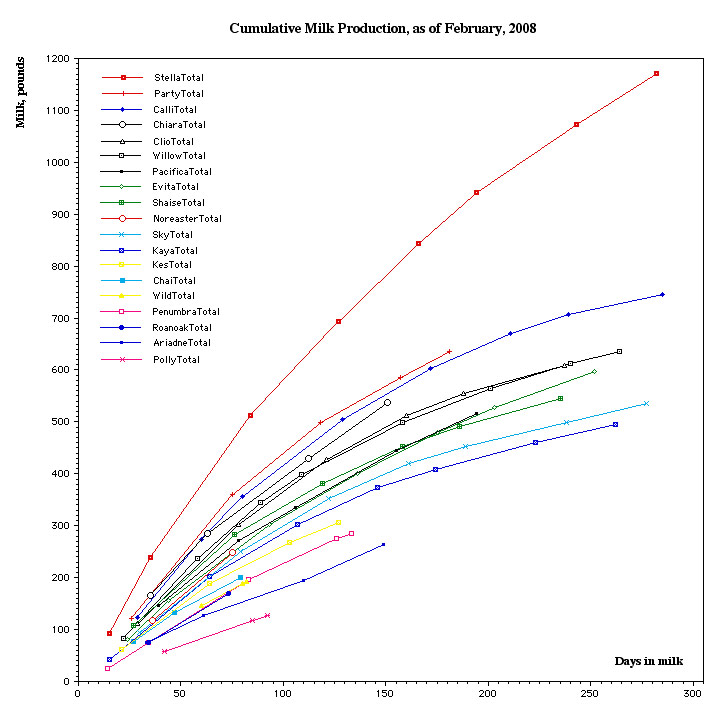
My milkers are ranked in order: Stella, Party, Calliope, Chiaroscuro, Willow and Clio (tie), Pacifica, Evita, Shaise Lounge, Nor'easter, Skylark, Kaya, Kestrel, Chai Tea, Penumbra and Something Wild (tie), Roanoak, Ariadne, and Polly (who had a traumatic kidding and lost her kids, so I think I can forgive her for being last!)
| For Sale | ||||
| Yearlings | ||||
| Bucks | New Arrivals | Kidding Schedule | Links | Herdbook |
|
|
|
|
|
|
|
|
|
|
|